R packages
fluctuator
Link to github repository with documentation
A package to draw metabolic flux maps with R. SVG is the primary choice for scalable, open-source graphic files. This packages provides a simple interface to import SVG graphic files in R, modify these in a programmatic way, and export the files again. The purpose of this package is to overlay scientific data on medium or large scale network representations, which is too laborious and time-consuming to do manually. SVG Graphics have to be drawn beforehand, for example using Inkscape. Objects (“nodes”) are than identified and modified using unique IDs/label in R.
Installation
To install the package directly from github, use this function from
devtools package in your R session:
require(devtools)
install_github("https://github.com/m-jahn/fluctuator")
Example
See the package README for usage details. The package can be used to automatically overlay metabolic fluxes from e.g. FBA on metabolic flux maps.
| Original SVG | SVG with overlaid fluxes |
|---|---|
 |
 |
lattice-tools
Link to github repository with documentation
This package contains panel functions and wrapper functions for the R lattice package, a general purpose plotting package from Deepayan Sarkar. Lattice’s functionality is comparable to the popular ggplot2 package but has a slightly different look and feel. The functions collected here were added over time and might not always adhere perfectly to the lattice conventions. However some care was taken to replicate the original lattice behavior so that users can use grouping and paneling as they are used to. Feel free to copy, fork or source functions that you find useful. Contributions welcome!
Installation
To install the package directly from github, use this function from
devtools package in your R session:
require(devtools)
install_github("https://github.com/m-jahn/lattice-tools")
Examples
panel.barplot
Draw barplot with error bars in lattice plots. This custom panel function for lattice plots allows to draw barplots with error bars for arbitrary groups of data points. Error bars will be drawn for groups of identical x values with optional subsetting by grouping or paneling variables.
library(latticetools)
library(lattice)
data(mtcars)

# we can use a grouping variable similar to other lattice panel functions
xyplot(mpg ~ factor(cyl), mtcars,
  groups = cyl, lwd = 2,
  panel = function(x, y, ...) {
    panel.barplot(x, y, ...)
  }
)

panel.directlabel
Point labels for scatterplots. Draw text labels for all points of a scatterplot using functions from directlabels. In contrast to the
functionality of the original directlabels package, every point is labelled instead of groups. Labels are also independent from the
grouping variable, so that e.g. colors indicate a grouping variable and labels another. By default, labels adapt the graphical parameters of the higher level plot, including coloring according to groups. However, many parameters can be customized.
library(grid)
library(lattice)
library(directlabels)

data("mtcars")
mtcars$car <- rownames(mtcars)

# A standard example using lattice grouping and paneling;
# We can also draw boxes around labels and change label size
xyplot(mpg ~ wt | factor(cyl), mtcars,
  groups = cyl, pch = 19, labels = mtcars$car,
  as.table = TRUE, layout = c(3, 1), cex = 0.6,
  panel = function(x, y, ...) {
    panel.xyplot(x, y, ...)
    panel.directlabel(x, y, draw_box = TRUE, box_line = TRUE, ...)
  }
)

WeightedTreemaps
Link to github repository with documentation
Generate and plot Voronoi treemaps or Sunburst treemaps from hierarchical data. Treemaps are a visually appealing graphical representation of numerical data using a space-filling approach. A plane or ‘map’ is subdivided into smaller areas called cells. The cells in the map are scaled according to an underlying metric which allows to grasp the hierarchical organization and relative importance of many objects at once. This package contains two different implementations of treemaps, Voronoi treemaps and Sunburst treemaps.
Installation
The C++ code computing the actual Voronoi tesselation requires the CGAL headers. This requirement is now satisfied with the R package cgal4h so that local installation of CGAL is no longer required.
To install the package directly from github, use this function from the devtools package in your R session:
require(devtools)
install_github("https://github.com/m-jahn/SysbioTreemaps")
Examples
The functions to create Voronoi (or Sunburst) treemaps take a data.frame as main input. The data.frame should contain column(s)
with numerical or categorical data (i.e. a character vector).
library(SysbioTreemaps)

df <- data.frame(
  A = rep(c("a", "b", "c"), each = 15),
  B = sample(letters[4:12], 45, replace = TRUE),
  C = sample(10:100, 45)
)

tm <- voronoiTreemap(
  data = df,
  levels = c("A", "B", "C"),
  cell_size = "C",
  shape = "rounded_rect"
)

drawTreemap(tm, title = "treemap 1",
  color_type = "categorical", color_level = 1,
  layout = c(1,3), position = c(1, 1))

drawTreemap(tm, title = "treemap 2",
  color_type = "categorical", color_level = 2, border_size = 3,
  add = TRUE, layout = c(1,3), position = c(1, 2))

drawTreemap(tm, title = "treemap 3",
  color_type = "cell_size", color_level = 3,
  color_palette = heat.colors(10),
  border_color = grey(0.4), label_color = grey(0.4),
  add = TRUE, layout = c(1,3), position = c(1, 3),
  title_color = "black")

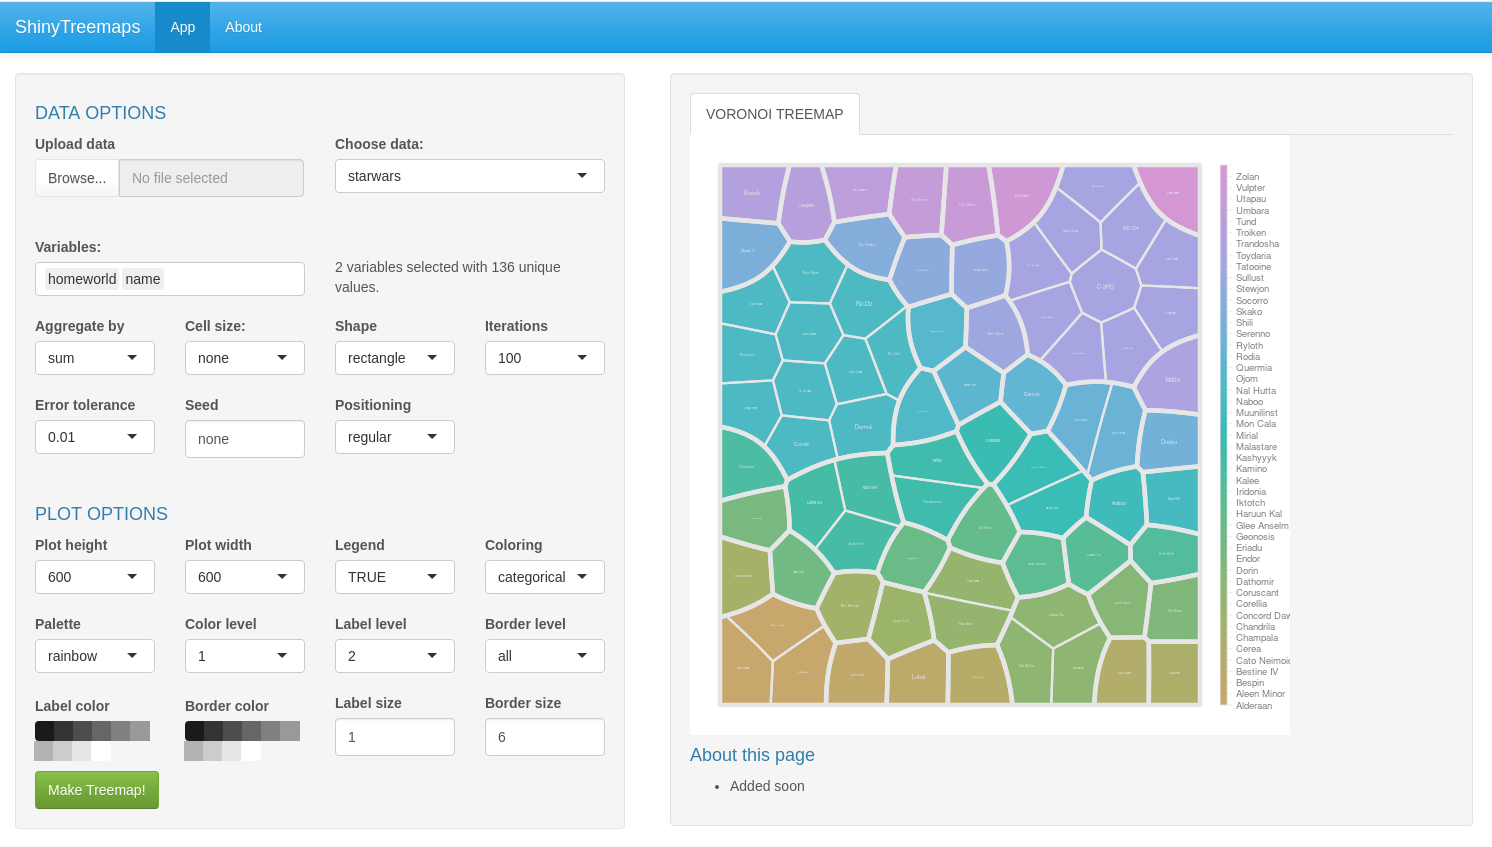
ShinyTreemaps
R Shiny based web app to generate Voronoi treemaps and sunburst treemaps. Available on Shinyapps.io!
Link to github repository with documentation
ShinyTreemaps is a wrapper for the SysbioTreemaps R package. Users can upload their own data in csv format, egnerate treemaps, and stylize them with different default layout and color schemes.
Features
- upload your own tables
- generate Voronoi treemaps
- customize visual appearance
- download in high resolution
pngor assvgvector graphic
ShinyLib
R Shiny based web app for browsing fitness data from transposon or CRISPRi libraries. Available on Shinyapps.io!
Link to github repository with documentation
ShinyLib is an app for exploration of gene-centered data from enrichment or depletion studies. Usually, a library of thousands of mutants can be grown in competition experiments, leading to the depletion of growth-inhibited mutants and enrichment of faster growing mutants. By extracting the DNA and sequencing the barcode/sgRNA of the mutant population, we can assess which genes are essential or contribute to fitness under which condition.
Features
- Displays dot plots of fold depletion/enrichment over time
- Heatmaps and clustering of proteins/genes by fitness similarity
- Fitness scores can be plotted as variable of one or two conditions
- The original data table can be filtered by pathways or single genes, and selected data can be downloaded
- Different variables can be plotted on X and Y axis, or used as conditioning variable (panel-view)
- All charts are interactive R Shiny modules and can be adjusted by many parameters

ShinyProt
R Shiny based web app for browsing proteomics data. Available on Shinyapps.io!
Link to github repository with documentation
ShinyProt is a web app for exploration of gene expression, proteomics, or other gene-centered biological data.
Features
- Displays dot plots of gene expression data
- Heatmaps, box and whisker plots, and clustering of proteins/genes by expression
- Dendrogram of gene expression similarity
- Sunburst treemaps (coming soon!)
- The original data table can be filtered by pathways or single genes
- Different variables can be plotted on X and Y axis, or used as conditioning variable (panel-view)
- All charts are interactive R Shiny modules and can be adjusted by many parameters

ShinyMC
R Shiny based web app for monitoring bioreactors. Available on Shinyapps.io!
Link to github repository with documentation
ShinyMC is an app for monitoring bioreactor experiments. Its purpose is to keep track of ongoing cultivations in MC-1000-OD bioreactors from Photon System Intruments (PSI, CZ). Other sensors can be connected to ShinyMC as well via import of text-based measurement files.
Features
- Display of optical density (OD at 680 and 720 nm wavelength)
- Display of growth rate calculated from OD, based on either interval growth rates or frequency of dilutions
- Display of temperature, light intensity, and other sensor measurements such as offgas
- All charts are interactive R Shiny modules and can be adjusted by sliders, check boxes and many other parameters

Last updated: 2022-01-18